Key Findings
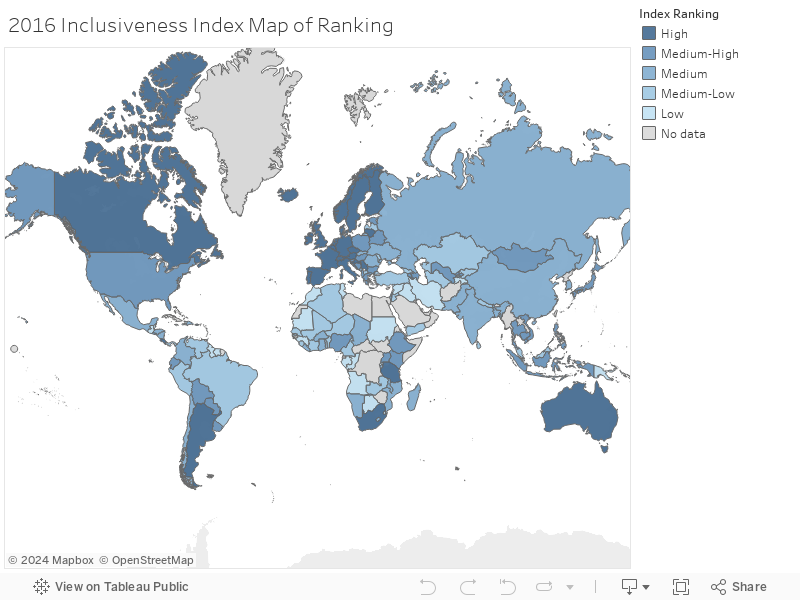
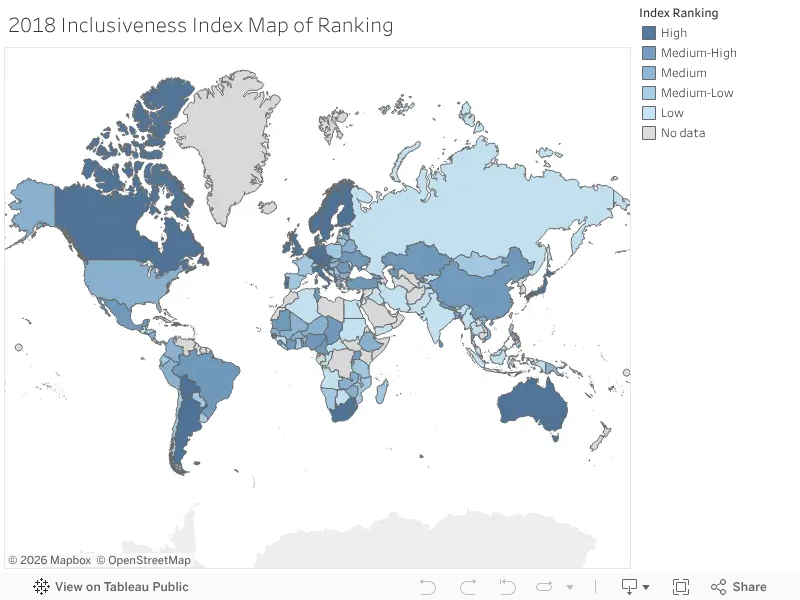
Over the last five years, the Othering and Belonging Institute at the University of California, Berkeley, has used the Inclusiveness Index as a tool to measure degree of inclusivity and marginality specific groups face
around the globe. In the maps above, we can see how the overall inclusiveness changes within countries year over year, as nations continue to pass laws that protect historically marginalized communities or conditions for these
groups worsen. One thing that has not changed is the fact that the Netherlands has earned the title of “most inclusive” every year from 2016 to 2020. The Netherlands has ample representation of people from historically marginalized
communities in the lower house of parliament, relatively minimal income inequality, low incarceration rates, and creates laws that protect the rights and freedoms of every person, regardless of background. Whereas the top ranked
country has stayed the same over the last five years, the lowest ranked country in the Inclusiveness Index has changed each year. In 2016, Syria had an Inclusiveness Index of 0, but it was replaced by Rwanda in 2017. While Yemen
scored the lowest in 2019, Iraq earned an Inclusiveness Index of 0 in both 2018 and 2020. Many of these countries were experiencing civil war, fraught elections, internal conflict, and political turmoil that restricted the rights of its citizens.
The Inclusiveness of a nation is determined in this Index based on results of six indicators that represent the experience of historically marginalized communities. The globally recognized demographic groups are based on race, gender, religion,
disability, membership in the LGBTQ+ community, and other indicators, such as income inequality, political freedoms, and displacement. Both the race indicator and the disability indicator are both calculated based on a single measure. The results
of the race indicator find that countries that are currently or have previous experienced civil war, such as Syria and Rwanda, have the highest proportion of ethnic minority groups that are discriminated against, powerless politically, or self-excluded
in 2019. Meanwhile, countries that are ethnically homogenous, such as Austria and Japan, tended to have the smallest proportion of ethnic minority groups discriminated against, powerless politically, or self-excluded in 2019. The disability
indicator was calculated exclusively based on a ranking of anti-discrimination laws protecting the rights of the disability community. Countries that provide members of the disability community with protection from discrimination in the law ranked
higher than countries that did not, earning a higher z-score for the indicator overall.
While the race and disability indicators had just one measure of inclusivity, the rest of the indicators were calculated using several measures of inclusiveness. The gender indicator is calculated based on the results of a dozen measures of gender equity,
based on factors of representation, access to financial resources, income parity, rights protections, freedom of movement, and more. Overall, countries that did not score highly in the z-score for the gender indicator in the Inclusiveness Index tend to
restrict the movement of women and their access to services, silence their political voice, have high rates of women’s incarceration, and limit the rights of women rather than protect them. Countries that fared the best have a high proportion of women
represented in public life, protect women from gender-based violence and discrimination, and provide women with access to resources and political expression. Nations that seek to find true gender equality should pursue codifying these rights and protections
into law as well as promote increased representation of women in government and the workforce. In terms of gender parity, Burundi, Sweden, and Mozambique all had the highest z-scores and Thailand, Kuwait, and the United States all had the lowest z-score for
gender. The United States likely scored so low on the gender indicator given its low proportion of women represented in the lower house as well as its astronomically high incarceration rate of women.
In recent years, there has been an increased push, following decades of activism, to protect the rights of the LGBTQ+ community. The index is calculated based on two measures: an index on LGBTQ+ community rights and the percentage of lawmakers that belong to
the LGBTQ+ community in the lower house of parliament. Overall, the Netherlands had the highest Z-score, given its high index on community rights and its outsized proportion of lawmakers who belong to the LGBTQ+ community, at 16%. Countries that tended to fare
the worst in the overall Z-score for this indicator were largely those that criminalize same-sex relationships and forms of gender expression, such as North Korea. The religion indicator is calculated based on two additional indexes: a social hostilities index
and a government restrictions index. Countries such India and Syria had the highest indexes on social hostilities towards people of other religious backgrounds while many island nations, such as Saint Maarten and Palau, had an index of 0.0, indicating no social
hostilities towards other based on religion. The government restrictions index measures the level of restrictions countries place on religious groups. Once again, many island nations had an index of 0.0 on this measure, while China had the highest government
restrictions index. Since government law is created based the values of those in power, countries that have high hostility towards people of other religions tend to create laws that restrict the practices of faith-based groups. We can see this trend in action
when examining the relationship between the social hostilities index and the government restrictions index, with some notable exceptions. While China did have the highest government restrictions score, it had a low social hostilities score.
The last indicator used in the Inclusiveness Index is the general indicator, which looks at several different overarching criteria that, for this analysis, are divided into two categories: politics and economics as well as displacement and incarceration. Income
inequality is an important measure of inclusiveness, as it demonstrates how the country distributes wealth among the people. While South Africa has the largest amount of income inequality of any nation, Ukraine has the least income inequality. When examining the
political rights index, we clearly see that many countries, like China and North Korea, do not provide adequate rights for citizens to express their political opinions. However, many countries, like Australia and New Zealand had a higher political rights index
than the United States. While there is no discernable relationship between the Gini Index and the Political Rights Index, it is interesting to see how countries for every continent are at both the top and bottom clusters in the visualization. Regarding the displacement
indicators, just 41 nations had internationally displaced people due to conflict. Of those countries, the Central African Republic and Syria had the highest proportion of internally displace people due to conflict per 100,000 people. The average proportion of this
cohort is 1,118 internally displaced people per 100,000 people. While most countries have taken in some global refugees, most nations have less than 1,000 refugees per 100,000 people. However, countries like Lebanon, Latvia, and Nauru have more than 10,000 refugees
per 100,000 people. It should be no surprise that the United States has the largest incarceration rate per 100,000 people as well as the largest incarceration rate of women of any country in the world. Examining the relationship between these two indicators, it is clear
to see why United States has only been ranked Medium in the overall Inclusiveness Index Rankings over the last five years.
Learning Process
The learning process for this final project was an iterative and constantly evolving process. Given my work on this project was over the course of two months,
this allowed me the time to continually modify my project as I continually learned more. As I came up with new solutions, I would go back to visualizations I created weeks prior and apply my new ideas to make the
visualizations clearer and more interactive. I would describe most of the learning process for this project as learning by trial and error. With each new visualization I created, I wanted to try something for a new.
Sometimes the new idea did not work out due to the sheer number data points that needed to be visualized, so I had to come up with a new way to communicate the findings in the data. One challenge with visualizing
the data with a world map is that interesting findings are easy to see for geographically large countries, but almost impossible to discern for geographically small countries. For example, it is difficult to see that
dark shading of an outlier result of a small island nation. As somewhat of way around this problem, I added a country filter to each Tableau dashboard so the end user can filter to find whatever country or group of
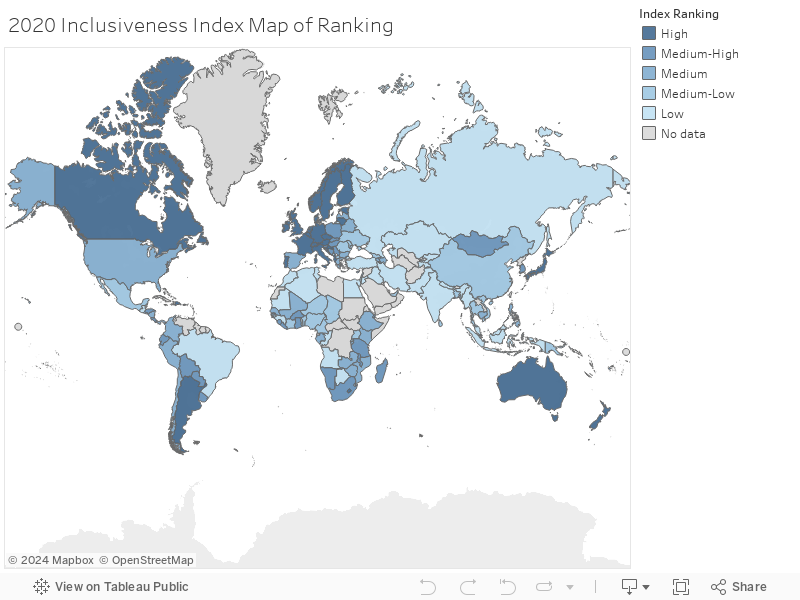
countries they are interested in analyzing. While the results of the 2020 Inclusiveness Index were released mid-way through my work on this project, I did find that the data was more incomplete last year than the
results 2019. Additionally, the results of the Inclusiveness Index could have been impacted by the COVID-19 global pandemic, and I did not want to risk potentially adding bias into the results of the project.
Therefore, I continued my analysis of the indicators from the Inclusiveness Index in 2019 and only added a map for the overall Inclusiveness Index for 2020. Overall, I learned so much over the course of this project,
not only about HTML, CSS, JavaScript, and Tableau, but also about the intricacies of how countries around the globe are working to make the world a more inclusive place.
Conclusion
Nations that seek to improve their ranking in the Inclusiveness Index need to look no further than their own constitutions, elected body of representatives and societal norms to find the answer. Codifying protections
for historically marginalized communities into law, diversifying the lower house of parliament, and promoting equity in the workplace and in society are key steps for any nation to take when working to create a more
inclusive society. Additionally, when considering the rights of women, it is critical to provide women with access to formal financial services, protections from gender-based violence and discrimination, and the freedom
to move throughout public life as they wish. Representation of minorities in elected government and free access to express political opinions are key methods governments can promote inclusiveness of minority voices.
Reducing income inequality by increasing the distribution of wealth throughout a nation is also an effective way to combat group-based marginality. In order to reduce incarceration rates, countries must reexamine the
penal code to assess how it disproportionately effects minority groups and change the laws accordingly. A country’s acceptance of refugees is reflective of a country’s values towards immigration. Countries that make it a core
government policy to welcome refugees are more inclusive than nations who have restrictive immigration and asylum policies.
In contrast to the Individual Project, the Inclusiveness Index is one measure in which the United States does not come out on top. In fact, the United States ranked among the lowest for the Z-score for gender equity and has
the highest incarceration rate of any country in the world. In recent years, the US has instituted increasingly restrictive immigration and asylum policies and removed anti-discrimination protections for marginalized communities.
In addition to the global analysis of the Inclusiveness Index, the Othering and Belonging Institute also conducts an annual analysis into the inclusiveness of each of the 50 states. While the analysis of US Inclusiveness by the
Institute does not include the District of Columbia, Puerto Rico, nor any other territories, it does provide an Inclusiveness Index for each state based on the same indicators as the global analysis. For future projects, it would
be interesting to examine the Inclusiveness Index for each state as well as across different regions of the country over the last five years.